Finding Surprises in your Data with Spark

In this post, I'll demonstrate my all-time favorite natural language processing (NLP) trick: "surprisal", a statistical measure of the unlikeliness of any event, which can be applied to just about anything that you can count. Scala is a wonderful language for this sort of data crunching, largely because of Apache Spark, a powerful distributed computing framework. For this post, I'll be using Apache Zeppelin as an interactive, web-based shell around Spark. If anyone's interested in following along, I encourage you to download a Zeppelin binary distribution and have fun!
For this project, what we want to do is accept an incoming snippet of text, and score it in a way that can answer the following questions:
- What is the surprisal of each word in the text?
- What is the most surprising word in the text?
- What is the total information content of the text?
All of these are useful metrics for real-world information retrieval. Typically, search engines return the most ordinary or popular document in response to a query, but in some cases, users want outliers, not typical results. Surprisals let us determine the most unusual items in a collection, and the most unusual features of each of those items, which opens up all kinds of interesting possibilities.
Before we start coding, however, we need to talk about data. For this post, I'm going to use the Brown Corpus, which was originally compiled in the 1960's. Compared to newer data sets like Google NGrams, the Brown corpus is tiny, about 1 million total words from 500 documents. What it has going for it is that it is a very clean, well-studied data set. The text is cleanly tokenized, and each word is annotated with a part-of-speech tag. Working with data as a sequence makes it possible to use tools like Markov Chains, part-of-speech tagging, and text segmenters, all of which pay attention to words in their linguistic context.
First Steps: Loading and Parsing
To start, let's download the Brown Corpus here. (Make sure to get the plain text version, not the XML). Now we're going to open up a new Zeppelin notebook and run the following code:
loadingIf you're unused to functional programming, this might not look like the kind of text processing code you've seen before. Basically, Spark uses methods like SparkContext.parallelize() and SparkContext.loadTextFiles() to create Resilient Distributed Data sets (RDD's), which are stored in chunks across all the nodes of the cluster. Then, I can use higher-order functions like map, flatMap, filter, fold, and reduce to transform the RDD, by defining pure functions that can safely be applied at a massively parallel scale. Finally, I'm using the .toDF() method on the RDD's to create DataFrames, which are a lot like distributed SQL tables, with convenient named columns, aggregation capabilities, and some other niceties.
Now let's look at our output. In Zeppelin, it will look something like this:
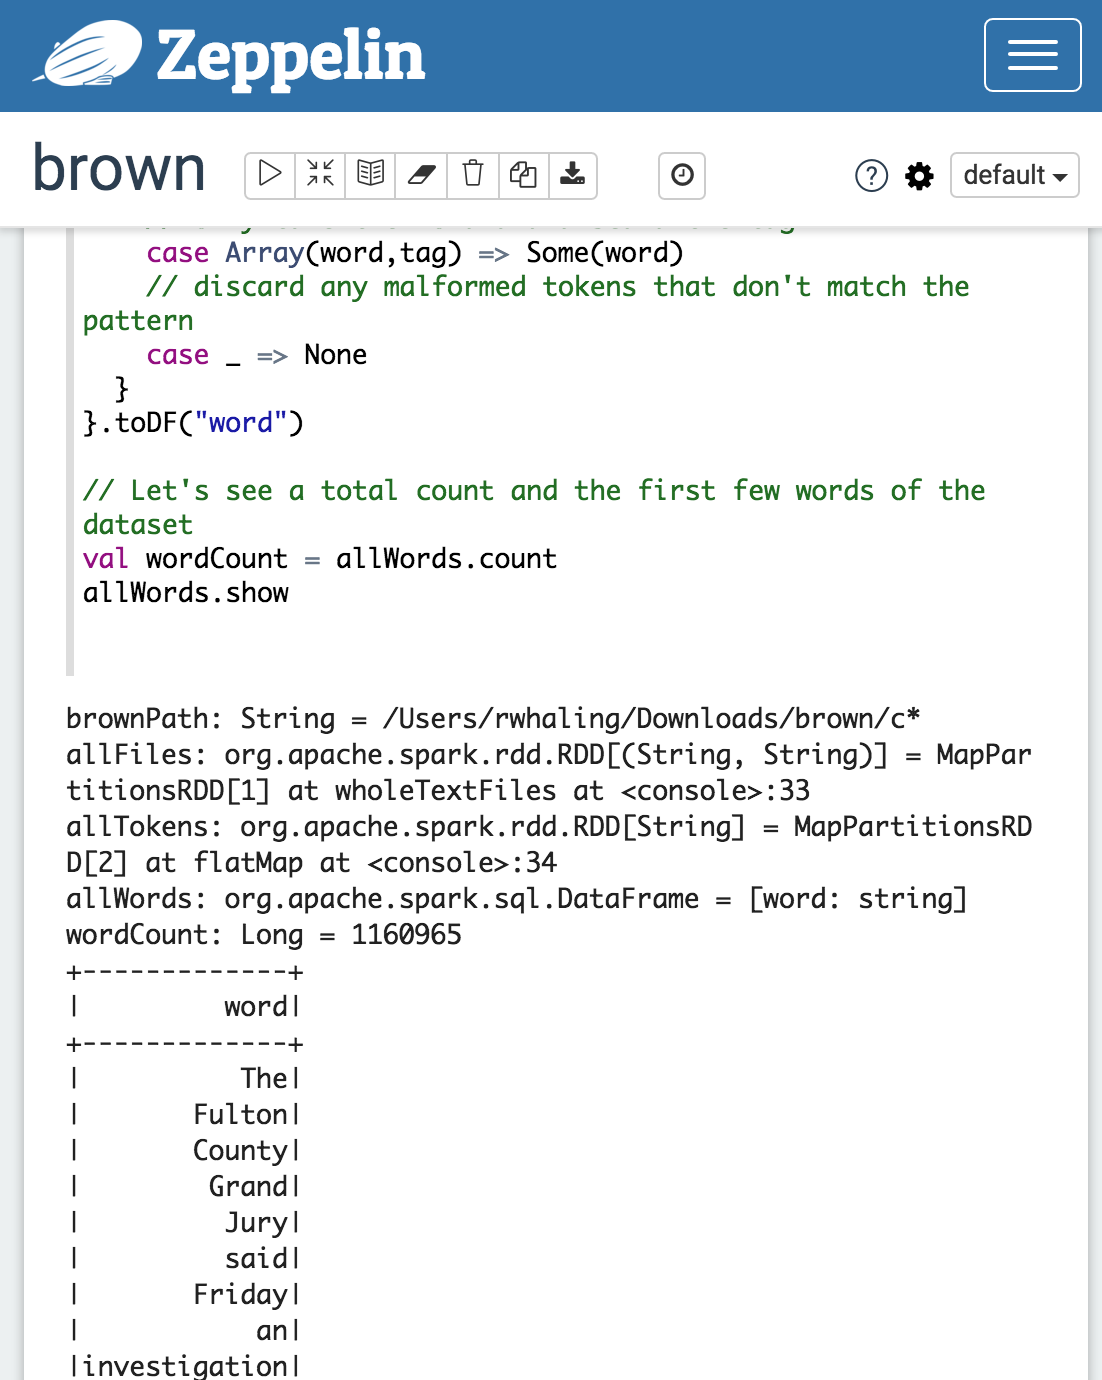
But I'm going to just paste the output in directly from here on:
loadingThis shows that we have 1160965 words to play with; not too many, but enough to make distributed computing meaningful. We can also see a fragment of the first sentence: "The Fulton County Grand Jury said...", from a 1961 newspaper article. So what are we going to do with this? Spark has excellent machine learning tools in their spark.ml and mllib packages, but in this case, we're going to write our own analytics, just using counting and some basic probability.
Calculating Surprisal
According to information theory, every event in a discrete random process, like rolling dice or flipping a coin, has a probability attached to it. Based on this probability, we can define the average amount of information carried by the process as a whole, which is referred to as entropy, as well as the amount information in each possible outcome, which is called self-information or surprisal. Both entropy and surpisal can be measured in bits or in other units, but I will stick with bits for this post.
Mathematically, if an event has probability ![P(Omega[n])](https://upload.wikimedia.org/math/c/3/a/c3adcae276aa48169ab58e6291892ae8.png) P(Omega[n]) then we can define its surprisal, or self-information
P(Omega[n]) then we can define its surprisal, or self-information ![I(Omega)[n]](https://upload.wikimedia.org/math/8/9/b/89bbe6ccc8bf1f01b42f023f4858e447.png) I(Omega)[n] as:
I(Omega)[n] as:
 Self-information Formula
In plain English, this means that the less probable an event is, the more information it contains, and thus it is more surprising. Informally, we can also refer to this measure as a "plog", or the "positive logarithm" of the probability of the event. Plogs are incredibly useful. They transform probabilities, which are typically very, very small numbers that you have to multiply together, into nice, chunky numbers between that you can add for all kinds of convenient ad hoc estimation. For example, an event with a probability of 0.5 has a surprisal of 1 bit, and an event with a probability of 0.25 has a surprisal of 2 bits, but an event with a probability of 0.000001 has a surprisal of just 20 bits.
Calculating surprisal is pretty easy in Scala, all you need is the count of the event in question and the total count of the distribution it belongs to. The one trick is that scala.math.log has a base of e, so there's an extra step to convert the base of the logarithm from e to 2. Let's just do a straightforward imperative implementation for now without using any special Spark features.
Scaling up with Spark
Now let's use Spark to calculate them for our data set. We're going to
- Group and count all the unique words in the data set
- Count the total number of word occurences
- Calculate the surprisal and probability for each unique word
- Store the word, count, probability and surprisal in a new DataFrame
What's awesome about Spark is that we can use the functions we've already defined without any modifications. Unlke with Hadoop or other cluster-computing frameworks, we don't have to specify when and how to partition and serialize data between batches. Instead, we just use the same functions that we would in any normal non-distributed program.
loadinglet's look at our results.
loadingSo what can we see here? The most common word our dataset is "the", a little more than 5% of all words, which is what we would expect for American English. Word frequencies drop off quickly from there, so that "of", the 2nd most frequent, is 3%, and "for", the 10th most frequent word, is only 0.5% of the total. In fact we only need the top 135 words to account for half of the total occurences. But how many words occur only once? Let's try this:
loadingWhich returns:
loadingSo this is interesting. There are more than 28,000 distinct words in the Brown corpus that occur only once, which is about half of all the distinct words, even though they only make up 2.4% of the total word occurences. (This is actually predicted by Zipf's Law, one of the most exciting findings in linguistics.)
Scoring, Lookup, and Joins
Now that we've analyzed all of this data, we can build a simple scoring engine from it.
In theory, this should be pretty easy to implement. We already have a table of every word with its total count, probability, and plog. All we need to do is take in new text, tokenize it, and look up the plog in that table. But in a distributed system, joins are slow and expensive, because our table is itself distributed, and sliced up into pieces on each node in our Spark cluster. Even with Zeppelin, which by default is running just a 4-node local cluster, the communication overhead of doing a join on distributed RDD's is serious:
loadingThis code calculates surpisal correctly, but it takes almost 5 seconds to score 36 words! To speed this up, we're going to use a technique called a map-side join. Because our lookup table has fewer than 60,000 words, we can easily convert the whole thing into a standard Scala Map object. Then, using Spark's broadcast variables, we can keep an immutable copy on every node in the cluster for fast in-memory access.
loadingThis code returns the same results, but runs in less than a second, which is much more reasonable.
Analysis
Now let's take a look at the results. Since our data set if from the 1960's, should expect to see high surprisal values for any word that has become widespread since then, which gives us a rough measure for how language changes over time.
loadingSo what I'm really interested in from this result is three words: the two highest scoring words, "powered" and "sidelines", with plogs of 19.15 and 20.15 respectively, and then "uptick", which doesn't have a score, because it does not occur at all in the Brown corpus. I have some hypotheses as to why: "powered" and "sidelines" are both commonplace metaphors in business and economic reporting now, but I doubt they were in the early 1960's. Further, while the Brown corpus does contain some specialized economic material, it doesn't contain much in the way of consumer-oriented business news. "Uptick" is more interesting, because it's pretty common term now, which suggests that it became common at some point in the last 50 years since the Brown corpus was compiled.
This opens up some questions for deeper analysis: for example, if we had access to a larger data set of a larger span of time, we could measure when "uptick" starts appearing, in what contexts, year by year, from 1960 to the present. Fortunately, there's a really rich data source for this sort of question: Google N-grams. They even have a nice online viewer, and we can look at the historical usage of "uptick", for example:
And what we see here confirms our hypothesis. "Uptick" doesn't really start to take off, in terms of relative frequency, until about 1980 or so. "Powered" and "sidelines", on the other hand, have a much slower, gradual ramp up from the early 20th century, but both also show a noticable increase starting in the 70's and 80's as well. (Google also reports a single use of Uptick in 1710, but that is almost certainly an anomaly or a data quality issue)
So, this is promising. We've figured out how to use Spark to load in (somewhat) large amounts of data, and analyze it for probability and surprisal. We've also devised a (somewhat) efficient algorithm for scoring incoming data. But there's still a lot more to do; in future posts, I'll demonstrate how to handle much more data with a production-ready Spark cluster, more techniques for efficient joins, and how to expose these analytics as a service with Akka HTTP.